Measures that matter
Eine Firma in Australia wollte ein graphic design und hat 2 Marketing graphic designs von 1 Designers bekommen
Designs
Designer
Budget


-
 Previous page
- You're on page 1
- Page 1 of 1
-
 Next page
1 - 2 von 2 Grafik-Designs Vorschläge
Hier ist was ein Geschäft in Australia für sein graphic design vorgenommen hatte.
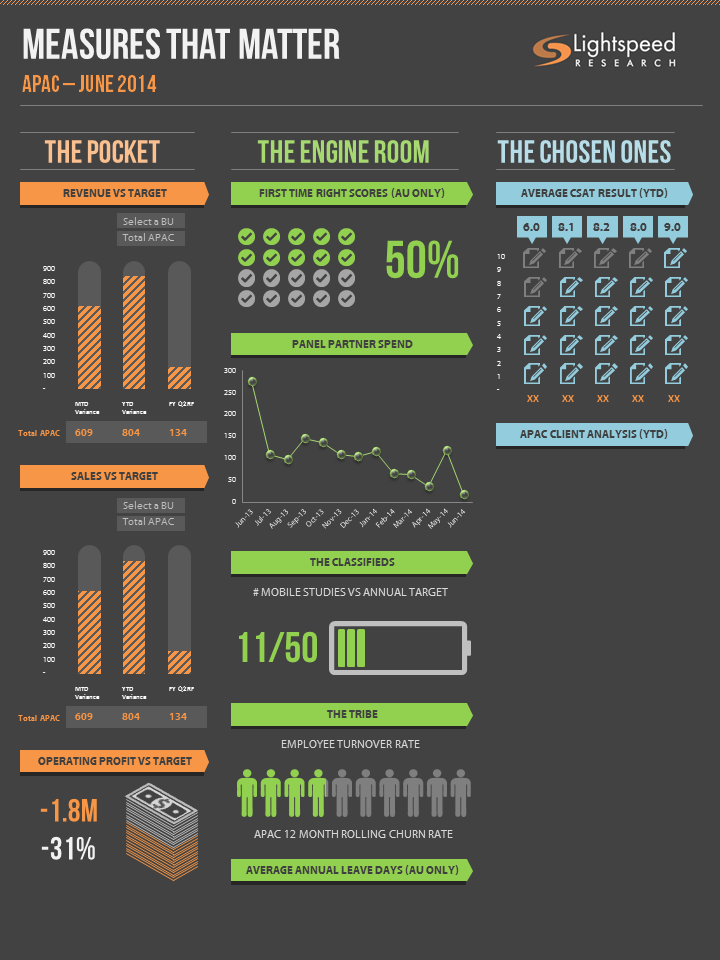
An internal dashboard of regular company results but with a twist!
No boring stats need apply- we want this to be visual and easy to digest for all staff on a monthly basis.
For instance, instead of a pie chat depicting the number of mobile projects won, make this a mobile charge icon ie 10 out of 50 = a fifth of charge. Or for churn rate of employees leaving the company, instead of a bar chart show 2 out of 10 people icons to show 20%.
This is built from a spreadsheet where formulas and pull throughs are already set so functionality needs to be intact.
There is one measure where there is a drop down filter, this should remain as a bar chart but be jazzed up as much as possible.
Branding elements and colours shown in the spreadsheet template, also attached is an example presentation so that you can gauge the brand tone.
Hoping for some awesome ideas here- let's show finance that design and marketing make a massive impact!
Mehr lesen