Medical Simulation - Creative Graphic for Data
Wollen Sie auch einen Job wie diesen gewinnen?
Dieser Kunde bekam 9 PowerPoint-Designs von 3 Designern. Dabei wurde dieses PowerPoint-Design Design von Annie Creative Service als Gewinner ausgewählt.
Kostenlos anmelden Design Jobs finden- Garantiert
-
 US$150
-
 9 Designs
-
 3 Designer
PowerPoint-Design Kurzbeschreibung
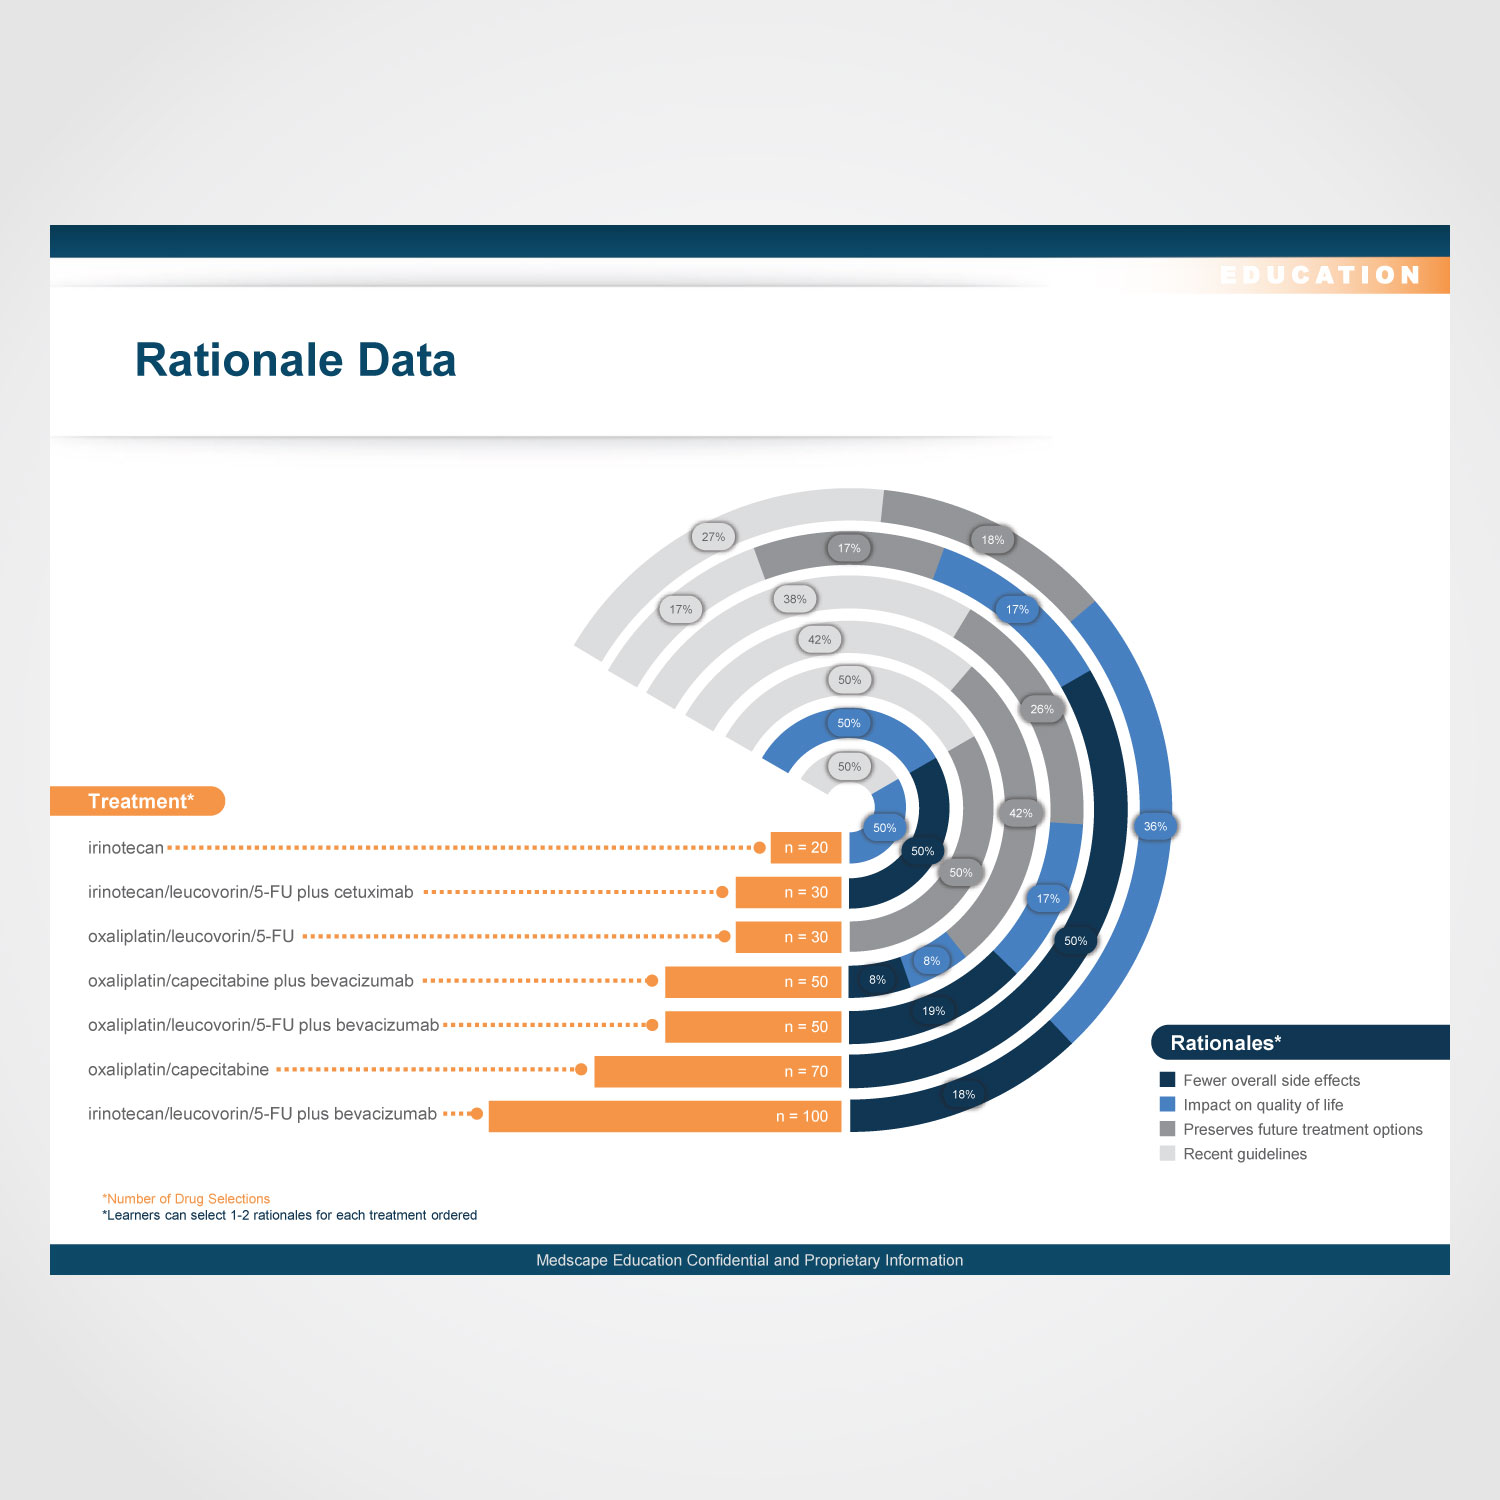
My company needs a creative graph that depicts the rationales (or reasons) our learners chose certain drug options. Basically, our clients not only want to know how many times certain drugs were selected, but the "whys" behind their choices. I would like a PPT graphic that I can use for other deliverables, where I can simply switch out the drug (treatment) names, the "whys" (what we call rationales), and the specific metrics (percentages, "n" numbers, etc), and the graphic will update and adjust to the new information. The title of the graph (or the slide where the graph will live) should be something like "Treatment Rationales" or something to that effect. Include a placeholder for text to go if anyone wants to add an analysis of the graphic later. This placeholder should accommodate 2-3 bullet points of text. We want this graphic to not just be an image, but organized in a way that you would see in a presentation slide, with a title, place holder for analysis (as indicated above), branding colors, and helpful information to understand the graphic (what is included in this post and it's associated attachments).
I've included specific drug names, rationales, and metrics to use for this (please see excel document). If you are going to design the graph directly in PPT, please use the PPT template design included. Please don't feel like you have to use 1 slide only or can have multiple graphs, if that makes sense for you design idea. They just need to fit within the coloring of the PPT. For font, please use Arial. Below is a Google Drive Link to branding colors and vector art.
https://drive.google.com/open?id=0B7OZ7Eaw9-IgS09qQmJiX2ZmbWs
We are open to many variations and design ideas. Please don't feel like you have to limit yourself! I've attached a few ideas that we've had and it may be a good place to start. We would ESPECIALLY like to see a version utilizing the radial graph (similar to the one included in the Rationales_DesignIdeas document).
Please reach out if you have any questions. Thanks!
Industrie/Einheitstyp
Drug
Sehen und fühlen
Jeder Schieber zeichnet eine der Charakteristiken der Marke des Kunden aus sowie den Stil, den euer Logo widerspiegeln sollte.
Elegant
Fett
Spielerisch
Ernst
Traditionel
Modern
Sympatisch
Professionell
Feminin
Männlich
Bunt
Konservativ
Wirtschaftlich
Gehobenes
Anforderungen
Schön zu haben
- It would be great to see the radial graph as a design variation (see link below)
- http://6.anychart.com/products/anychart/docs/users-guide/img/Samples/radar-chart-fixed-radius.png