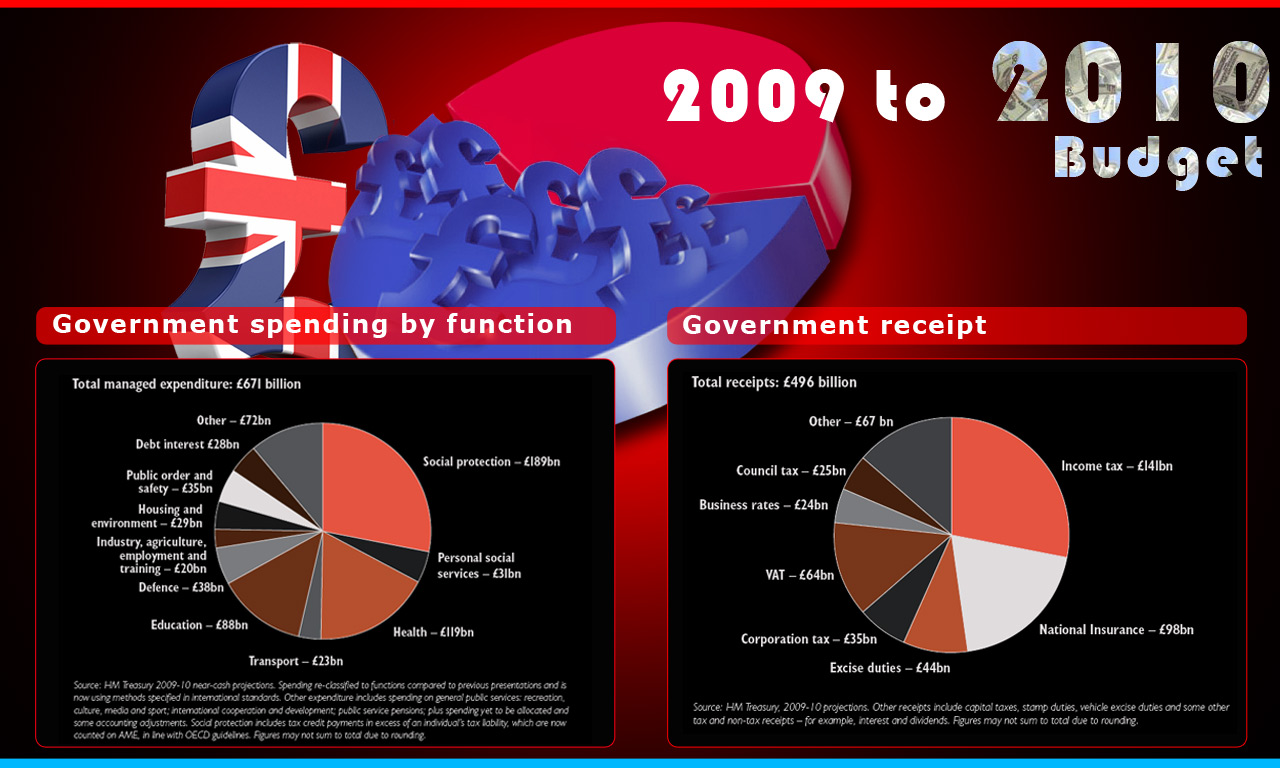
Confused.com infographic
Wollen Sie auch einen Job wie diesen gewinnen?
Dieser Kunde bekam 3 Infografik-Designs von 2 Designern. Dabei wurde dieses Infografik-Design Design von ReckonCreations als Gewinner ausgewählt.
Kostenlos anmelden Design Jobs finden- Garantiert
-
 £180
£180
-
 3 Designs
-
 2 Designer
Infografik-Design Kurzbeschreibung
We need an infographic that summarises the UK Budget (announced XX/XX) incomings (taxes) and outgoings (government expenditure).
We would be looking for a design that highlights the UK government debt compared with tax receipts in 2010 compared with 2009 if this could be fitted into one graphic.
Would be good to make pretty pictures of where the money is coming from and where it is being spent - if a comparison with 2009 isnt possible we will settle for just doing this for 2010 - though think a comparison to show the changes from 2009 to 2010 would be nice.
The graphic should be able to fit onto a 1280 x 768 px screen and still be readable.
Zielmarkt/( -märkte)
35-60 year olds that are financially savvy and AB1
Industrie/Einheitstyp
Graphic Design
Sehen und fühlen
Jeder Schieber zeichnet eine der Charakteristiken der Marke des Kunden aus sowie den Stil, den euer Logo widerspiegeln sollte.
Elegant
Fett
Spielerisch
Ernst
Traditionel
Modern
Sympatisch
Professionell
Feminin
Männlich
Bunt
Konservativ
Wirtschaftlich
Gehobenes
Anforderungen
Muss haben
- The infographic must contain the ingoings and outgoings marked in bold on the attached document.
Schön zu haben
- a comparision of how this differs from 2009 to 2010 however will settle for an infographic focusing on the 2010 budget only if this is what time allows.
- ALSO - we need this by Monday morning 29th March latest.
Sollte nicht haben
- offensive imagery