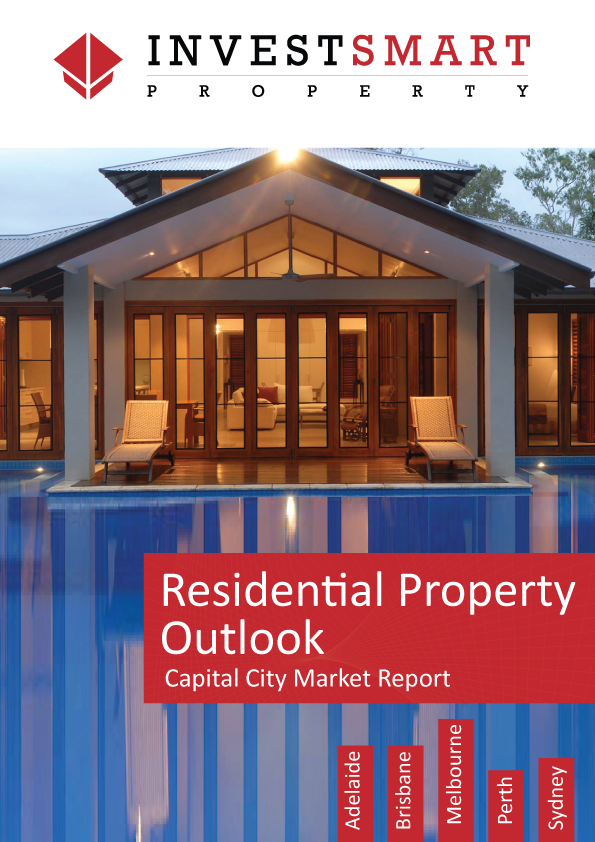
Residential Property Outlook - Quarterly Investment Update - Q1 2014

Wollen Sie auch einen Job wie diesen gewinnen?
Dieser Kunde bekam 8 Broschüren-Designs von 3 Designern. Dabei wurde dieses Broschüren-Design Design von TedAtkinson als Gewinner ausgewählt.
Kostenlos anmelden Design Jobs findenBroschüren-Design Kurzbeschreibung
We are wanting a designer to design an ebook on Residential Property in Australia. This ebook is a quarterly report and covers 5 major capital cities in Australia. This is the first quarterly report for the year - another 3 are needed to be created. If you are chosen as our designer please expect ongoing work which is well rewarded.
To begin with:
We will only need you to design a few pages so we can see your style. Then if you are chosen we will get you to do the whole thing.
Can you please design the title page, page 5 and the Adelaide section(page 6 & 7) of the The Residential Property Outlook - Quarterly Investment Update - Q1 2014 document attached.
The ebook brief:
You will need to create 2 graphs to include in the ebook from the data I give to you for each capital city (one graph for houses and one graph for units).
We already have a style of ebook in mind from a previous ebook our in-office designer has created for our company. You will need to keep with the logo/style/colours/fonts etc. We are looking for a designer based in Australia.
Sources and content:
Below I have shared a dropbox folder with you. It contains the first ebook our designer has created for you to view the style,logo etc - InvestSmart-Property-ebook. The folder also contains the source files for the logo.
https://www.dropbox.com/sh/9l0wox6qrr1n8tw/AAD773i7mpl28TEOYQMQ_jvsa#/
The Residential Property Outlook - Quarterly Investment Update - Q1 2014 document attached is the content we need made into the ebook.
Each page has been set out with the content needed for that page. Each capital city content spreads out over two pages with a graph on each. I have highlighted in red the data needed to create each of the graphs. The graph style must look like the Market Outlook image in the shared dropbox folder.
You will also need to redesign the graph on page 5. You may do this how you like as long as it keeps in the style of the ebook. We will also need the source files on this ebook.
Industrie/Einheitstyp
Investment