East Bakersfield Children Zone Presentation
Wollen Sie auch einen Job wie diesen gewinnen?
Dieser Kunde bekam 4 Broschüren-Designs von 2 Designern. Dabei wurde dieses Broschüren-Design Design von Norden Soul als Gewinner ausgewählt.
Kostenlos anmelden Design Jobs finden-
 US$130
-
 4 Designs
-
 2 Designer
Broschüren-Design Kurzbeschreibung
The objective is to design a presentation package of the demographics, needs, and opportunities of the east Bakersfield neighborhood we have identified as the "East Bakersfield Children Zone." We are looking for compelling imagery to communicate the dire statistics of the impoverished neighborhood.
Aktualisierungen
Here is the text for the brochure:
Williams Neighborhood, for the purposes of this project, is defined by Census Tract 6029001202. The eastern boundary of the neighborhood is Mt. Vernon Avenue. The most northern area is bordered by Flower Street until it hits Haley Street on the east. Moving south, the boundary expands eastward to Beale Street at Kentucky street. The southern boundary is Sumner and Edison Highway.
There are 5, 715 people who live in this neighborhood.
Census Tract: 6029001202
Goal: To create a vibrant, safe, and healthy east Bakersfield community- full of opportunity and excellence.
Why this neighborhood?
Williams Elementary has the highest number of students on free and reduced lunch in the district, with 98.6 % of students qualifying.
The neighborhood surrounding the school is densely populated; very poor; highly uneducated; and very young. At the same time, the built environment is old. The Kern County Sheriff’s department describes the county portion of this city/county neighborhood as one of the most dangerous areas in the County. No Doubt, what happens in this neighborhood- for better or for worse- will impact greater Bakersfield for years to come.
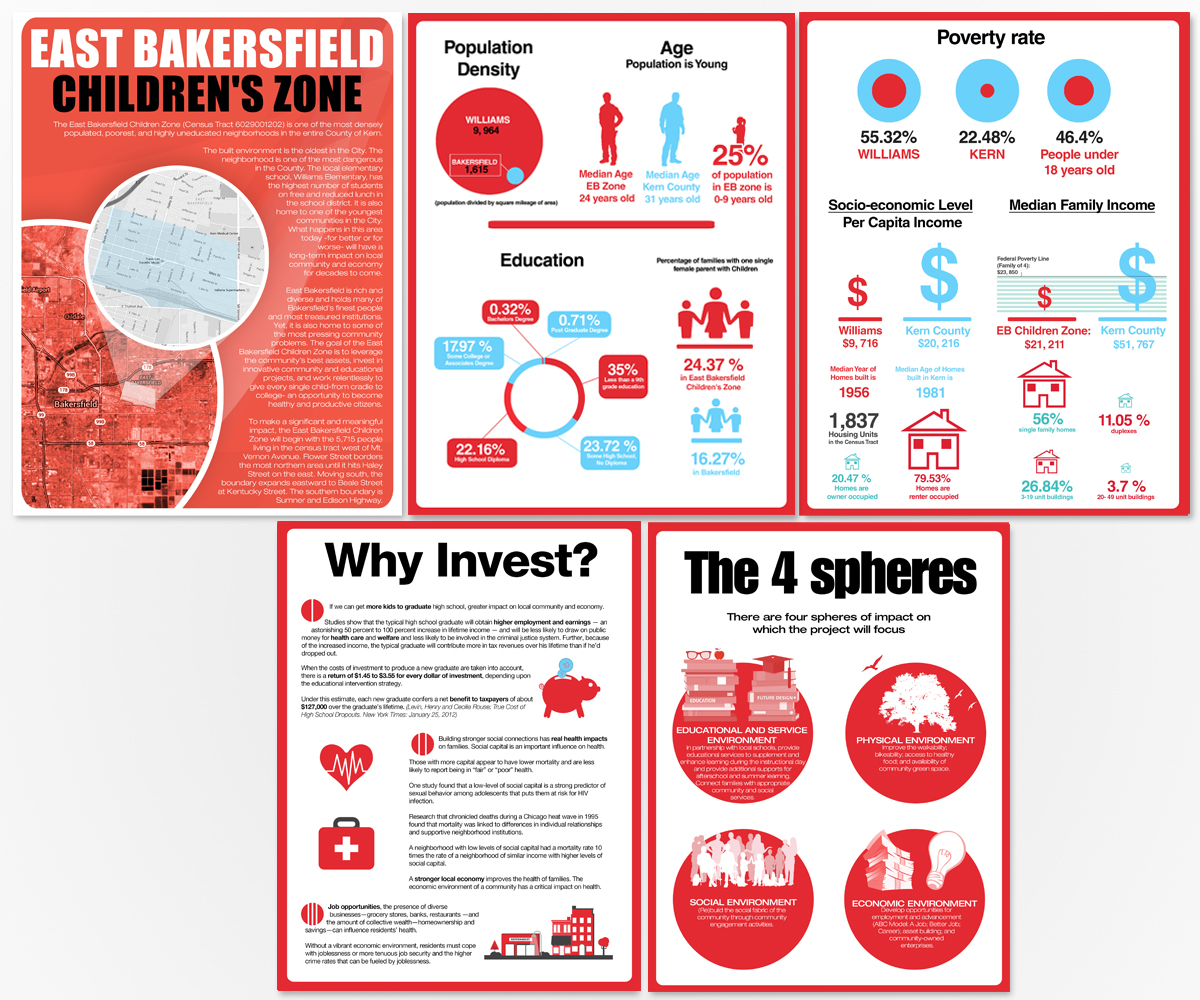
Population Density
Population Density: 9, 964 (calculated by population divided by square mileage of area). Bakersfield is 1,615.16
Education
35% of people 25 years or older have less than a 9th grade education between 2008 -2012
( Source: 2010 Census and ACS)
23.72% of people 25 years or older who have some high school but no diploma
22.16% of people 25 years or older have high school diploma
.32% bachelors degree
Socio-economic Level
Per Capita Income: $9, 716 (Source: Census)
Kern County: $20, 216
Poverty Rate: 55.32 % in Poverty
Kern Poverty Rate is 22.48%
46.4 % of people in poverty in this census tract are under 18 years old.
Age
Percentage of families with one single female parent with Children: 24.37 %;
16.27 % in Bakersfield
Population is young: Median age is 24 Years old;
25% is 0-9 years old. 18 % of Bakersfield.
Housing
Median year of homes built: 1955
There are 1,837 Housing Units in the Census Tract.
20.47 % of homes are owner occupied; 79.53% of homes are renter occupied.
56% of housing units are single family homes
11.05 % of housing units are duplexes
26.84% of housing units are 3-19 unit buildings
3.7 % of housing units are 20- 49 unit buildings
Why Invest?
If we can get more kids to graduate high school, greater impact on local community and economy.
Studies show that the typical high school graduate will obtain higher employment and earnings — an astonishing 50 percent to 100 percent increase in lifetime income — and will be less likely to draw on public money for health care and welfare and less likely to be involved in the criminal justice system. Further, because of the increased income, the typical graduate will contribute more in tax revenues over his lifetime than if he’d dropped out. When the costs of investment to produce a new graduate are taken into account, there is a return of $1.45 to $3.55 for every dollar of investment, depending upon the educational intervention strategy. Under this estimate, each new graduate confers a net benefit to taxpayers of about $127,000 over the graduate’s lifetime.
(Levin, Henry and Cecilia Rouse; True Cost of High School Dropouts. New York Times: January 25, 2012)
Building stronger social connections has real health impacts on families.
Social capital is an important influence on health. Those with more capital appear to have lower mortality and are less likely to report being in “fair” or “poor” health.53 One study found that a low-level of social capital is a strong predictor of sexual behavior among adolescents that puts them at riskfor HIV infection.
Research that chronicled deaths during a Chicago heat wave in 1995 found that mortality was linked to differences in individual relationships and supportive neighborhood institutions. A neighborhood with low levels of social capital had a mortality rate 10 times the rate of a neighborhood of similar income with higher levels of social capital.
A stronger local economy improves the health of families.
The economic environment of a community has a critical impact on health. Job opportunities, the presence of diverse businesses—grocery stores, banks, restaurants —and the amount of collective wealth—homeownership and savings—can influence residents’ health.39 Without a vibrant economic environment, residents must cope with joblessness or more tenuous job security and the higher crime rates that can be fueled by joblessness.
Model for Change
Williams Neighborhood Initiative is based on Harlem Children Zone Principles:
Serve an entire neighborhood comprehensively and at scale to create a “tipping point” and definitively shift the culture of the community
Create a pipeline of coordinated, best-practice programs to give our children and families seamless support from birth through college and maximize their outcomes
Build community among residents, institutions, and stakeholders in order to create a healthy, positive environment where our children can thrive
Evaluate program outcomes and create a feedback loop to provide managers with real-time data and strengthen services
Cultivate an organizational culture of success rooted in passion, accountability, leadership, and teamwork
There are four (4) spheres of impact on which the project will focus: Social; Educational; Economic; and Environmental
Social Environment
(Re)build the social fabric of the community through community engagement activities.
Educational and Service Environment
In partnership with local schools, provide educational services to supplement and enhance learning during the instructional day and provide additional supports for afterschool and summer learning.
Connect families with appropriate community and social services.
Economic Environment
Develop opportunities for employment and advancement (ABC Model: A Job; Better Job; Career); asset building; and community-owned enterprises.
Physical Environment
Improve the walkability; bikeability; access to healthy food; and availability of community green space.
Phase 1: Build Community, Improve Built Environment, and Establish Positive Neighborhood Identity - 2015
Phase one focuses on short-term, strategic actions that make real, long-term change to the neighborhood. The goals of the first phase are to (1) make significant and meaningful improvements to the neighborhood that can be felt immediately; (2) foster neighborhood resident leadership and a sense of ownership by inviting them to participate in the work; and (3) create a community green space that will serve as the hub for dialogue, neighborhood events and interaction, and design of future community building activities.
Immediate steps: (November 2014- January 2015)
Monthly Cleanup Days
Planting of 100 Oklahoma Red Bud Trees to give neighborhood distinct character.
Paint Address numbers in neighborhood
Walk Your City.org walkability signs directing families to critical social services such as Parent Resource Center; Library; and Clinics.
Formation of a Neighborhood Committee/ Comite de Vecinos
Walk Group/Sunday walks at Williams
Relationship Building/ Develop Neighborhood Database
Develop Williams Neighborhood Landlord Alliance
Intermediate steps: (November 2014- March 2015)
Hire two (2) Family Navigators to connect families with existing services and identify service gaps.
House lights in neighborhood
Solar Powered Street lights
Mural
Community Survey
Lake Street Canal Cleanup
Phase 2 Tree Planting, another 60 trees.
Long Term Steps: (November 2014- June 2015)
-Adopt City-owned property for community outdoor center.
Longer Term: (November 2014- Ongoing)
Phase 2: Employ Family Navigators to identify family needs; marshall community resources to meet family needs; and determine (document) gaps in services.
Phase 3: Develop Cradle to Career Pipeline and programs to meet gaps in services.
Added Tuesday, November 18, 2014
Project Deadline Extended
Reason: We're extending the deadline to get at least three options.
Added Monday, November 24, 2014